Priority is building more than a way to document home visits. We are building a connected model of the patient, the care process, the mobile workforce and the financial result — and using that model to coordinate real operations.
Healthcare data usually lives in separate systems. We are building a model that connects the patient, their condition, care team, resources, interventions, outcomes and costs into one operational picture.
Traditional healthcare software stores information as isolated records. A patient record lives in one system. A hospital discharge exists in another workflow. An ambulance visit exists somewhere else. Claims arrive later. Follow-up appointments are tracked separately.
The result is a great deal of data and no complete operational picture.
Priority's MIH platform is being designed differently. It creates relationships between the real-world things involved in care, so the system can describe not only what happened, but who was involved, why an action occurred, what resources it required, what happened next, and what outcome followed.
We call that the MIH Ontology.
A structured digital representation of the people, organizations, events, resources, relationships and actions that make up a real-world care delivery system.
Select any entity to see what it touches. This is an illustration of the model, not a live view of any patient.
Tap a node — the relationships light up, and the link updates so you can send the view.
Swipe the diagram sideways to see the outer rings.
Choose an entity above. Everything it connects to will stay lit; everything else fades back.
Five true records. None of them knows about the others, so nobody can answer “did the thing we did change what happened next?” Switch to relationship view to see what connecting them makes possible.
A fictional patient, used to show how the pieces relate. Mary Johnson is not a real person and none of this is a patient record.
Mary Johnson
Congestive heart failure
CHF exacerbation.
Discharged three days ago.
ALS-capable home visit within 24 hours.
MIH Unit 2
6 lb weight gain.
Medication dosing discrepancy.
Telehealth escalation to the patient's own clinician.
Medication corrected.
Cardiology appointment scheduled.
Instead of storing these as unrelated events, the ontology connects them as one care journey — which is what makes the last box answerable.
A high-risk score on its own tells a hospital very little. The ontology carries the relationships behind the score: the recent discharge, the diagnosis, prior utilization, the medications, what was found in the home, the follow-up gaps and the clinical interventions already tried.
Need is only half the problem. The platform is designed to connect that need to crew availability, clinical capability, equipment on the vehicle, location, the schedule and the hospital's own protocol — before anything is promised to anybody.
Referral → intervention → finding → clinical action → follow-up → utilization → outcome → cost. Each link is recorded against the one before it, so the chain can be followed in either direction.
Over time, a connected record makes it possible to examine which interventions, timings, workflows and resources are associated with better results for which populations.
The value is not simply integrating data. It is integrating the decisions and the work that follow the data. Traditional integration stops once two systems have exchanged information — which is the moment the hard part begins.
Ten steps, each one owned by somebody and each one recorded against the step before it. A handoff nobody is holding is where follow-up quietly stops.
The patient leaves hospital following a CHF admission.
HospitalThe platform surfaces several potential risk factors together rather than one at a time.
PlatformA home-based intervention is proposed, with the reasoning attached.
PlatformA hospital care manager reviews the recommendation. Nothing proceeds without this.
Care managerAn appropriately equipped and qualified mobile clinical resource is identified.
Priority operationsA clinician performs a structured assessment under the agreed protocol.
Community paramedic / RNA potential deterioration or care gap is identified and recorded as structured information.
Field clinicianThe hospital or the patient's own clinician receives the findings, and the item stays open until somebody answers.
ClinicianMedication, PCP, specialist and support services are coordinated, each with an owner and a date.
SharedSubsequent utilization and program economics are measured against the episode.
Hospital & PriorityEach completed intervention produces new information: about the patient, about what the work actually required, about which findings turned out to matter, about the outcome and about the cost.
That information returns to the model, so the next recommendation is made against a fuller picture than the last one.
Live screens from Prism, our working MIH platform. Every patient, figure and organization shown in the demonstration data is illustrative.
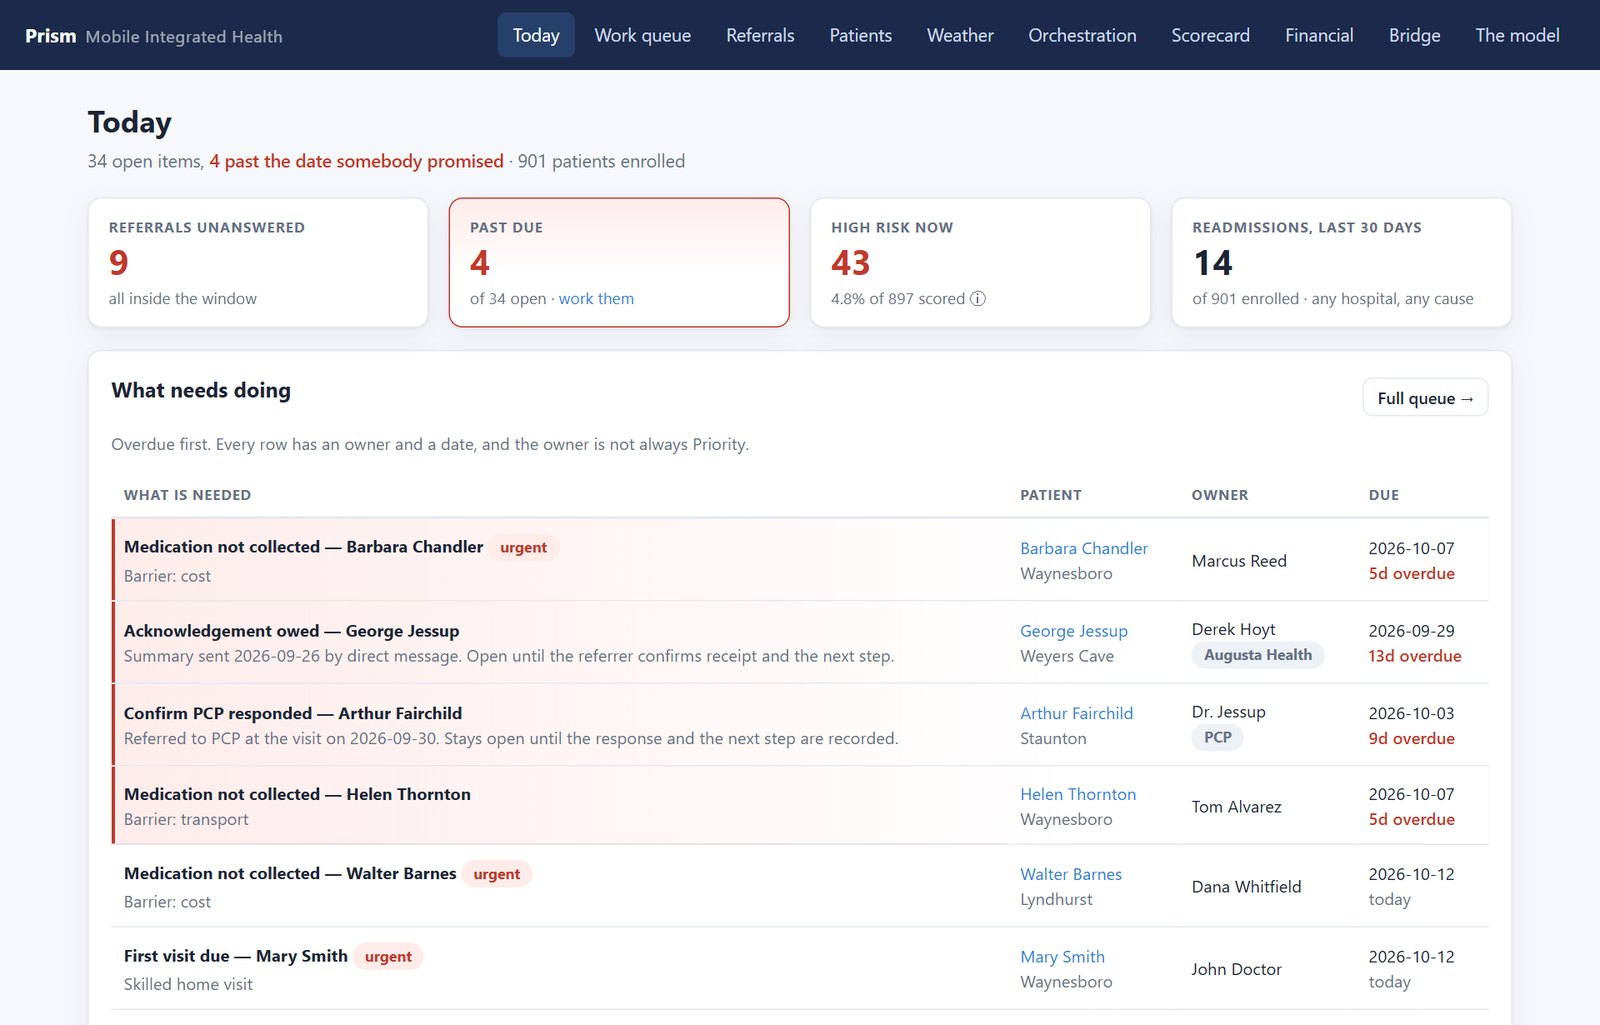
A program-wide view that surfaces the population, the risk, the work already in flight and what is overdue — in one place, ordered by what needs doing first rather than by when it was created.
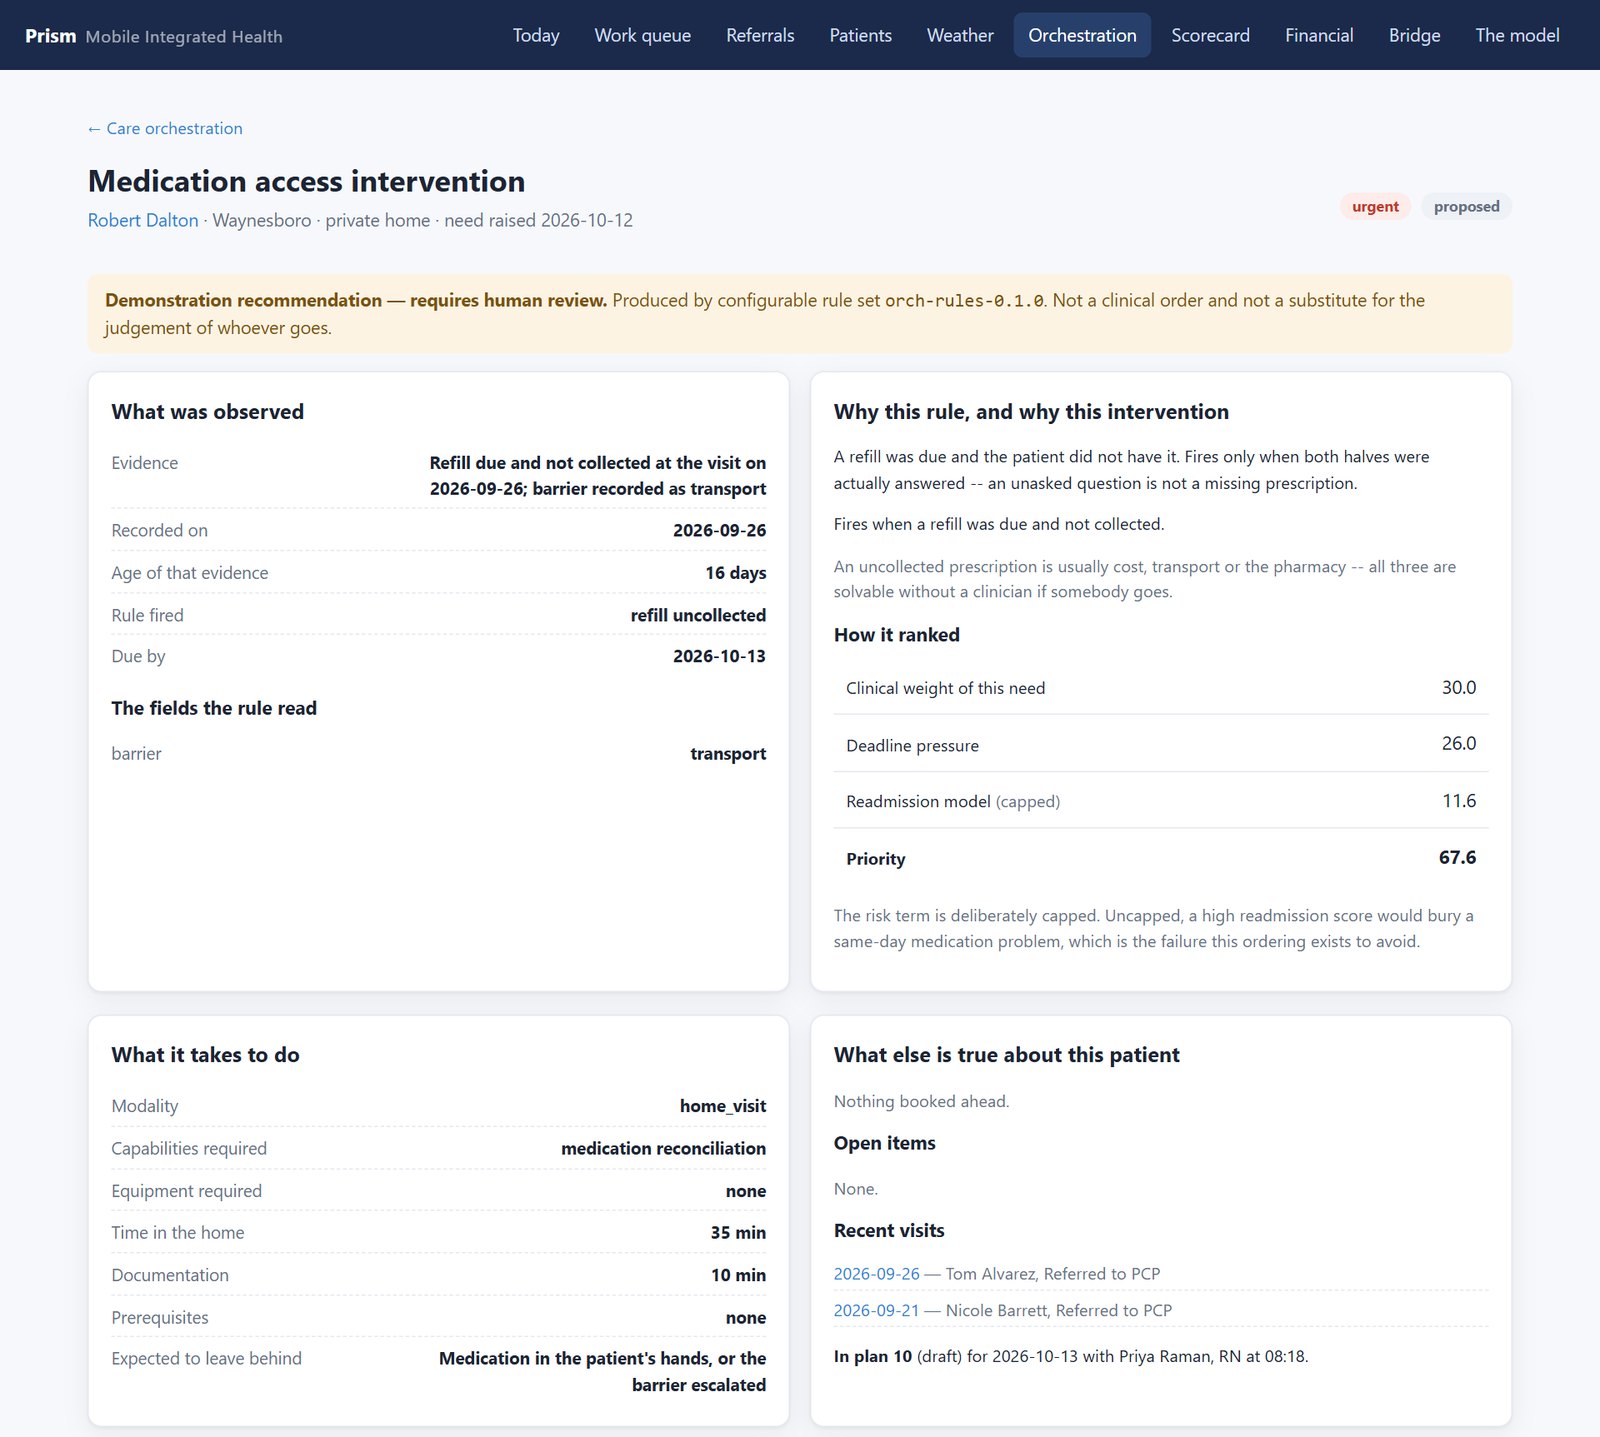
One recommendation, opened up: the evidence that raised it and how old that evidence is, the rule that fired and why that rule exists, the arithmetic behind the priority score, the capability and equipment the work needs, and how long it takes. The banner at the top says it is a demonstration recommendation requiring human review, because it is.
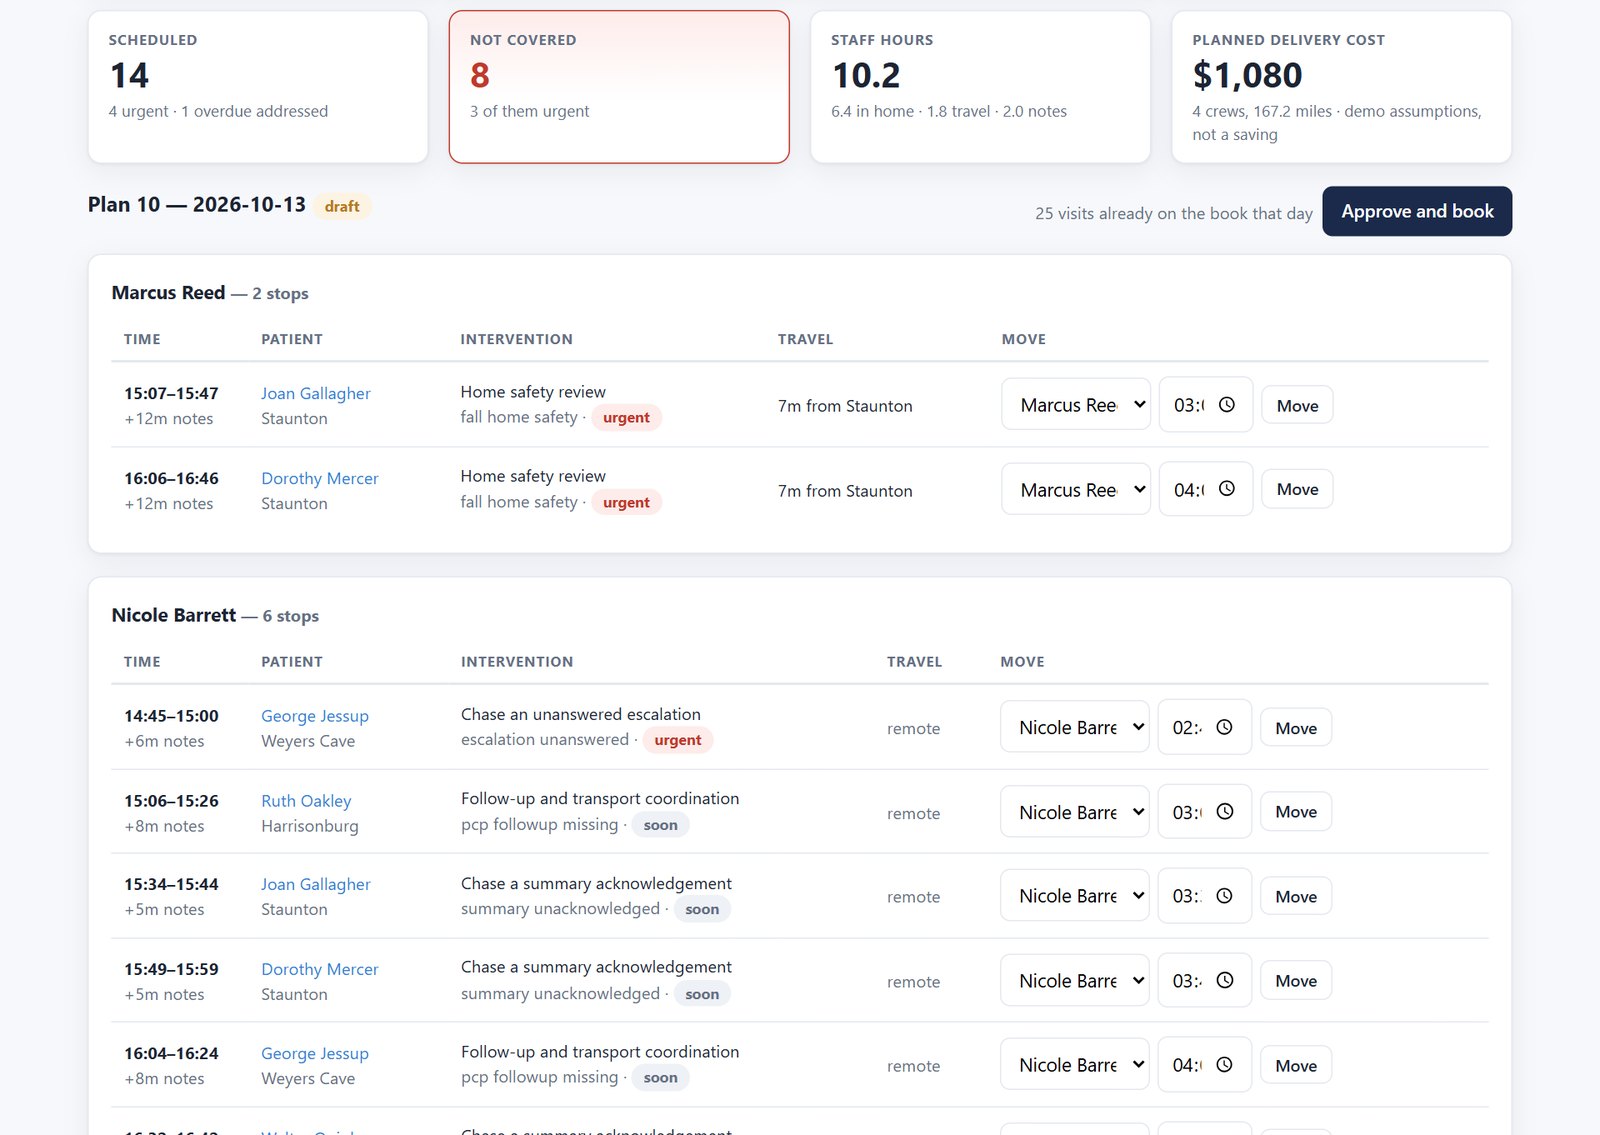
The plan matches need against who is working, what they are qualified to do, what is on the vehicle and how far apart the stops are — then says plainly what it could not cover and why. Nothing is booked until somebody approves it.
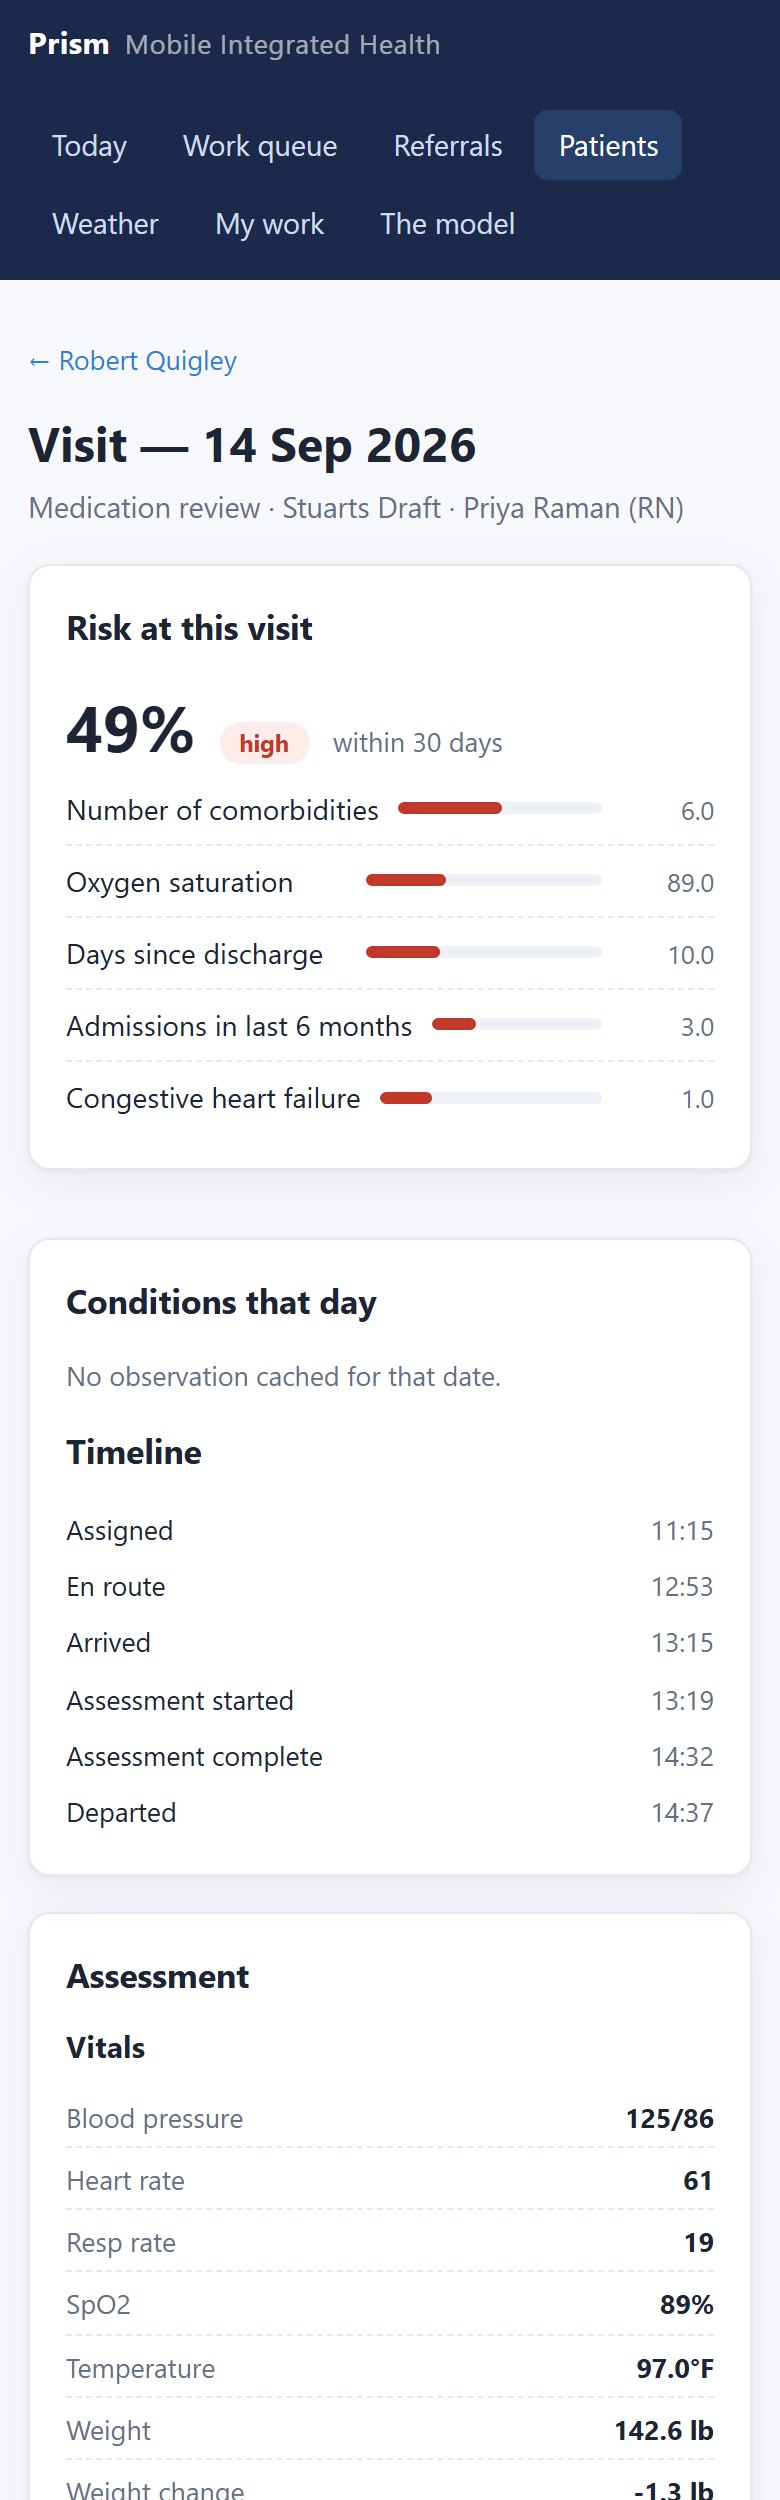
The clinician arrives knowing why. The visit opens with the risk at that moment and the factors behind it — comorbidities, oxygen saturation, days since discharge, prior admissions — then records the assessment as structured fields rather than a paragraph somebody has to read later.
Work only reaches a clinician once a plan has been approved. A draft is a proposal and deliberately does not leave the office.

Every episode carries its own cost, so the financial picture is built from the work rather than estimated after it. Programme fee for the window, cost per completed episode, utilization across the enrolled population, and the ED trips a clinician judged were avoided — all computed from the record and all available on any window you choose.
Plug in your own contribution margin, penalty exposure and base DRG payments, and the same page carries the arithmetic through to the net figure your finance team would actually defend.
Illustrative future-state architecture. Integrations are established per partner.
Two systems agree on a message format.
The work itself is the thing being integrated.
Every figure on this row is invented to show the shape of the question. None of it is a Priority result.
Not every need is a visit. Deciding that in advance is what keeps a mobile program affordable.
Orchestration is the step that turns demand into a day somebody can actually work.
Every measure is tracked against the episode that produced it, so the program can be judged on results rather than on activity.
Day 0 — the clock starts here.
Day 2 — several factors line up at once.
Day 3 — structured assessment in the home.
Day 3 — findings go to the patient's clinician.
Day 4 — the discrepancy is corrected and recorded.
Day 6 — the appointment that was missing now exists.
Day 30 — utilization, follow-up completion and cost are reviewed.
Knowing that a patient has CHF is useful. Knowing that the patient was discharged three days ago, has visited the emergency department twice recently, has a medication discrepancy, missed a cardiology follow-up, lives alone, needs specific diagnostic capabilities, and can be reached tomorrow morning by a qualified mobile team — that is an operational picture.
The ontology connects those facts. The orchestration layer turns them into a visit somebody actually makes.
Edge labels on the diagram are the
relationship types the model stores: HAS_CONDITION,
DISCHARGED_FROM, REFERRED_TO, ASSIGNED_TO,
REQUIRES, IDENTIFIED, ESCALATED_TO,
FOLLOWED_BY, RESULTED_IN and COST.
Why is this patient being prioritized?
Mary was discharged recently following CHF treatment, has a history of repeat emergency utilization, has a documented medication discrepancy, has gained weight rapidly, and has no confirmed cardiology follow-up.
What should happen next?
An ALS-capable MIH home visit within 24 hours.
Who can perform it?
MIH Unit 2 holds the required capabilities and is projected to be nearby tomorrow morning.
What happened?
The home assessment identified medication and fluid-management concerns, which prompted a clinician escalation and a scheduled follow-up.
Did it matter?
Subsequent utilization, outcomes, follow-up completion and program cost can be measured against the episode — and compared, once there is a comparison group to compare against.
The same ontology that describes a patient can describe the environment that cares for them: the providers, the crews, the equipment, the capacity, the hospital programs, the clinical events, the referrals, the outcomes and the costs — kept current as the work happens.
That makes it possible to reason not only about one patient's journey, but about the operating environment responsible for delivering the care: what tomorrow can absorb, where capability is thin, which towns are expensive to reach.
A continuously updated model of the real-world MIH environment — the people, the resources, the work and the results — rather than a static record of what was documented.
Priority is looking for hospitals and health systems interested in shaping how Mobile Integrated Healthcare is coordinated, measured and scaled — including how the results should be judged.
Discuss a hospital pilot Become a design partner
Both reach us at [email protected].